Access data walks give us a toolkit to explore how multiple perspectives can shape our collective understanding of the city, writes Louise Hickman.
As we walk around our cities, towns and villages, data is everywhere.
From street signs to CCTV cameras, ‘blister paving’ to tactile maps, different forms of data are logged and embedded into the fabric of our built environment.
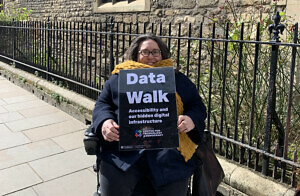
Louise Hickman on the Data Walk | Credit MCTD
As part of the Cambridge Festival, I collaborated with Dr Alison Powell to design and lead a walking tour through Cambridge City Centre. Working together, we wanted to offer our own perspective on different forms of data in our built environment.
We asked the group who joined us to rethink the way they saw the streetscape in front of them, to consider whether it was a ‘data rich’ environment or a ‘data calm’ environment.
So how do you know which could best apply to the street in front of you?
Data exists around us in so many different ways and a data rich environment could be one borne from many overlapping and differing types of data.
For example, let’s examine the presence of maps in the built environment.
We started our walk in Cambridge City Centre on King’s Parade. Here, there are large bronze tactile maps of the city, highlighting the road network and architecture. Tactile maps are designed to be read by touch. Tactile maps like these can guide blind and partially sighted users to find and situated themselves in relation to the spatial layout of the city, providing a tactile form of data on road names and buildings. We can understand these maps as form of tactile data that communicate accessible ways of wayfaring around the city.
Nearby, we drew together comments from participants on the walk to find the connections between the tactility of pavements and dropped curbs, to the history of disability rights movements in the United States, where disabled rights activists have long seen the city as a contested space for improving access. On these pavements/curb cuts, we spoke about the history of disabled activists reclaiming the curbs at the University of California, Berkeley.
In the 1970s, at the University of California, Berkeley, disabled rights activists took to the streets at night, ‘smashing up sidewalk’ curbs to demonstrate the inaccessibility of the built environment. Built into our streets, we can find the histories of movement, mobility and wayfaring informed by disability-led design practices.
In Cambridge, we see many different paving stones and metal insertions into the ground throughout the city, marking dropped kerbs, safer places to walk and smooth pathways through often cobbled streets. The extent to which these fabrics are entwined in the street highlights how access has been prioritised in the space.
We can also see data in other forms.
That is the iconic tree outside Trinity College. The infamous tree is said to have been grafted from Sir Isaac Newton’s original tree. During our walk, the tree receives a stream of attention from tourists and other passers-by stop to take images of it with their smartphones.
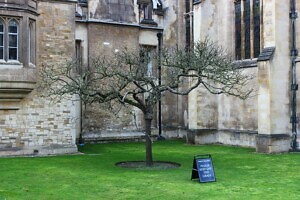
Newton tree at Trinity College, Cambridge | Lasma Artman for Unsplash
We asked, what happens to these images, are they logged at a time and tagged in a location when uploaded to social media? How many times a day is this one tree photographed? This tree and the data collected extensively on it, provide it with a new existence in the digital ecosystem. This is an area of Cambridge we identified as ‘data rich’.
In contrast to the heightened visibility of the iconic newton tree, we found areas marked as ‘data calm’ through the lack of accessibility among some of the side streets leading off the main thoroughfare of the city. On these streets, the lack of access to local businesses spoke of the exclusivity of these spaces. The entangled presence of data woven into these streets was discrete and mainly indicated a private distinction from the more public areas of the city.
The tension between ‘data rich’ and ‘data calm’ areas in the city – a methodology informed by Alison Powell’s research – serve as a useful toolkit to discuss how multiple perspectives can draw together different forms of data in our collective cityscapes. Who has access to the city? What types of services and commerce is available and to whom?
The tension between ‘data rich’ and ‘data calm’, as evidenced in the city of Cambridge, describes the coexistence of different types of people engaging with the city. And the diversity of these needs is not always captured by our digital city. For example, e-scooters (and the collection of this data) only reflect those that can connect and use the mobility devices. How we make sense of our city is evoked by moving and engaging through these spaces to understand the everyday intersection of data. Access data walks give us a toolkit to explore how multiple perspectives can shape our collective understanding of the city.
In my academic work, I focus on the automation of accessibility for disabled people, as well as on questions of social justice and processes of exclusion that are driven by the politics of austerity.